The new coronavirus (COVID-19, to be technical about it) is both something new and something old. As usual, this pandemic is both an aggregate demand and an aggregate supply shock. That makes it difficult to address with standard macroeconomic tools. As Richmond Federal Reserve Bank president Tom Barkin said, “central banks can’t come up with vaccines.” But this pandemic is really, really different.
The fact that it has hit China first and hardest makes it something new since China has, in recent decades, become the ‘OPEC of industrial intermediate goods’. Manufacturers around the world rely on parts and components made in China – many of them made in the hardest-hit provinces. While the disease seems to be subsiding in China, the Chinese manufacturing miracle has not yet returned to its miraculous volume of production. Moreover, the virus has hit three other leading members of Factory Asia – Japan, Korea, and Singapore. The virus-related disruptions in these East Asian nations alone will cause “supply chain contagion” in virtually all nations’ manufacturing sectors
Figure 1 China’s economy is recovering, but not recovered

Source: Financial Times COVID tracker.
And it gets worse. On Thursday 5 March 2020, when we finalised the eBook, the US was the ninth in the world in terms of the number of new cases recorded per day. Today, Friday 6 March 2020, the US is the seventh in that ranking of new cases. The number of new US cases reported rose 118% – in one day. That’s indicative of the sort of accelerating growth one sees as a growth process turns up the ‘elbow’ of an exponential curve. The number of daily new cases rose by 109% in Germany and by 89% in France over the past two days (Table 1). In short, the virus is spreading at an explosive pace in other G7 nations. This is no longer mostly a Chinese thing.
Table 1 New cases of COVID-19 reported per day, 5-6 March 2020

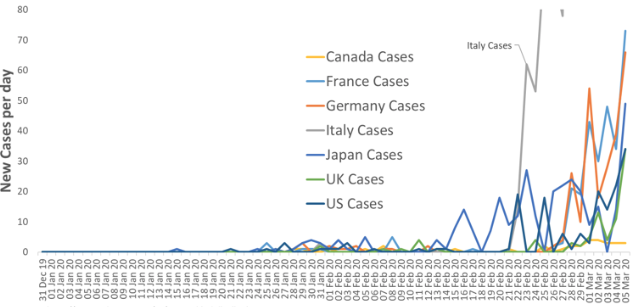
Italy has, for a couple of weeks, but well ahead of fellow G7 nations in terms of new infections. It now has fourth highest cumulative number of cases, at 3,858. But as Figure 2 shows, it looks like what happened in Italy is well underway in the rest of the G7. The figure is cropped at 80 new cases per day to allow easier eyeball comparison of Italy’s trajectory and that of the other G7 nations. Canada seem to be an exception in the healthy sense.
Figure 2 G7 medical shock: COVID-19 epidemiologic curve (new cases per day)

Source: ECDC (https://www.ecdc.europa.eu/en/geographical-distribution-2019-ncov-cases)
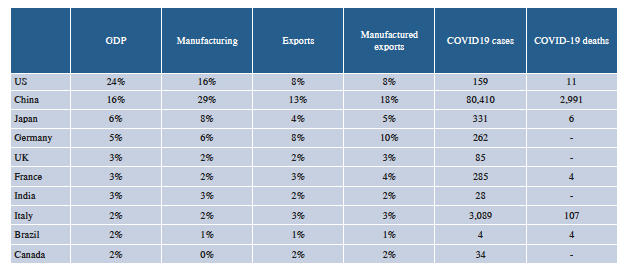
This spreading to the G7 really matters since it means that over half the world’s economy is infected. Table 2, from the eBook, illustrates this point using data from 5 March 2020.
Table 2 Large economies and COVID-19 (updated 29 February 2020)

The US, China, Japan, Germany, Britain, France, and Italy account for:
60% of world supply and demand (GDP)
65% of world manufacturing, and
41% of world manufacturing exports.
To paraphrase an especially apt quip: when these economies sneeze, the rest of the world will catch a cold.
These economies – especially China, Korea, Japan, Germany and the US – are also part of global value chains, so their woes will produce ‘supply-chain contagion’ in virtually all nations.
Data are already reflecting these supply shocks. The February 2020 read out on China’s key index of factory activity, the Caixin/Markit Manufacturing Purchasing Managers’ Index (PMI), showed its lowest level on record. “China’s manufacturing economy was impacted by the epidemic last month,” said Zhengsheng Zhong, chief economist at CEBM Group. “The supply and demand sides both weakened, supply chains became stagnant.” While China’s workforce is gradually returning to work, the Purchasing Managers Indices from across East Asia are showed sharp declines in production, especially in South Korea, Japan, Vietnam, and Taiwan.
The size of the economic shocks
Macro modellers are busy producing estimates of the size of the shock on the world economy. The OECD (see the chapter in the eBook by Laurence Boone) estimates that a base scenario, in which the outbreak is contained to China and a few other countries, could imply a world growth slowdown of about 0.5% in 2020. In a downside scenario, where the spread is spread widely over the northern hemisphere, the 2020 world GDP growth would be reduced by 1.5%. Most of the impact is attributed to lower demand, but in this scenario the negative contribution of uncertainty is also significant.
Mann discusses the possibility that this crisis will be U-shaped rather than V-shaped, as has been the case for similar epidemics and other recent supply shocks. Her point is that the linkages discussed will affect different nations differently. It may be a V shape, i.e. short and sharp with full recovery to the old growth path for some sectors and nations, but much more lingering for others. This suggest that in aggregate it could, at least for manufacturing, look more like a U-shape in the global data.
For services, the shock will be hard to recover, from so it may look more like an ‘L’. Growth drops for a while, and while it will resume eventually, there will be no catch up. People who skip a few restaurant meals, cinema outings, and holidays in the sun are unlikely to double-up on dining, movie-going and holidaymaking to catch up. The shock to tourism, transportation services, and domestic activities generally will not be recovered. Mann predicts that domestic services also will bear the brunt of the virus outbreak.
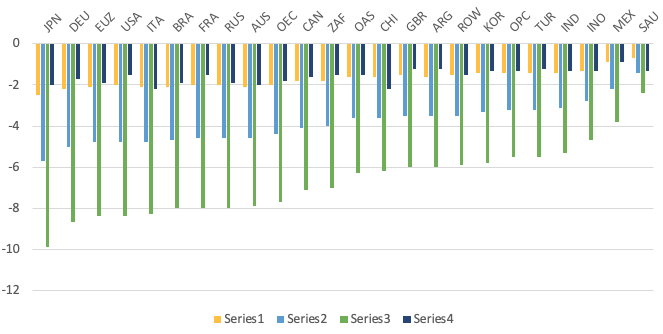
McKibbin and Fernando estimate the impact of different degrees of severity of a China-only shock and a global shock. In their most severe scenario (with very high infection rates), the impact on 2020 growth is four time greater than in Boone’s adverse case. In this scenario, Japan is the country with the highest hit of almost 10% GDP loss, followed by Germany and the US with losses of about 8% each.
Figure 3 GDP loss in 2020, deviation from baseline
Estimates by McKibbin and Fernando, S4-S7, gobal pandemic scenarios

The policy reactions
The behaviour of the virus is one thing; governmental reaction is another. As Weder di Mauro puts it in her chapter:
“The size and persistence of the economic damage will depend on how governments handle this sudden close encounter with nature and with fear.”
On the dark side, it could become an economic crisis of global dimensions and a long-lasting reversal of globalisation. On the bright side, it could be the moment when policymakers manage a common crisis response. They might even manage to rebuild some trust and create a cooperative spirit that helps humanity tackle other common threats like climate change.
One idea we think worthy of consideration is scaling up the EU Solidarity Fund. The fund was created in 2002 to support EU member states in cases of large disasters, like floods, earthquakes, volcanic eruptions, forest fires, drought and other natural disasters. The fund can be mobilised upon an application from the concerned country provided that the disaster event has a dimension justifying intervention at the European level.1 In 2018, the EU Solidarity Fund dispensed almost €300 million for relief following natural disasters in Austria, Italy and Romania.
Certainly, the disruptions caused by COVID-19 do amount to a natural disaster. Scaled up, the EU Solidarity Fund could step in to provide relief for affected regions and people and, beyond immediate relief, it would send an important signal.
We are optimists, so we closed the eBook optimistically:
“Jean Monnet´s famous words that Europe will be forged in crisis might ring true once more.“
References
Baldwin, R and B Weder di Mauro (2020), Economics in the Time of COVID-19, a VoxEU.org eBook, CEPR Press.
Endnotes
1 See https://ec.europa.eu/regional_policy/en/policy/evaluations/ec/eusf2002_…
First published on VoxEU.org


